Analysis on the Effect of Market Value on Rookie Performance
Does market value of a team have any impact on rookie performance? This question led me on a journey to find statistical evidence to find a correlation between the two.
This initial draft's audience is for old people, specifically my 63 year old dad. It took him around 10 years to learn how to use an Iphone. So be cautious of some of the oversimplifications of certain concepts. I tried to make this as old people-proof as possible.
The first thing I did was compile all the data in Excel by downloading a csv file of every NBA Draft from 2010-2019 from Basketball Reference. By using the SUMIF function in Excel I added the average BPM and VORP for each year of the draft(See Definitions Below). So if a team had three total rookies that year: One player had a BPM of -1, the second player had a BPM of 2.5, and the third player had a BPM of 0. The overall BPM would be 1.5. Then I proceeded to average that out per rookie for that given year. The average BPM for that team for that given year would be BPM:1.5/Number of Players:3 = BPM Avg:.5. I proceeded to do that for every team and every year for both the BPM and VORP.
I found the market valuations of all the teams on this website: https://www.hoopsrumors.com/2020/02/forbes-releases-2020-nba-franchise-valuations.html
Here is some definitions and information from www.Basketball-Reference.com
BPM = "Box Plus/Minus, Version 2.0 (BPM) is a basketball box score-based metric that estimates a basketball player’s contribution to the team when that player is on the court. It is based only on the information in the traditional basketball box score--no play-by-play data or non-traditional box score data (like dunks or deflections) are included."
"To give a sense of the scale:
+10.0 is an all-time season (think peak Jordan or LeBron)
+8.0 is an MVP season (think peak Dirk or peak Shaq)
+6.0 is an all-NBA season
+4.0 is in all-star consideration
+2.0 is a good starter
+0.0 is a decent starter or solid 6th man
-2.0 is a bench player (this is also defined as "replacement level")
Below -2.0 are many end-of-bench players "
VORP = "Value over Replacement Player (VORP) converts the BPM rate into an estimate of each player's overall contribution to the team, measured vs. what a theoretical "replacement player" would provide, where the "replacement player" is defined as a player on minimum salary or not a normal member of a team's rotation. A long and comprehensive discussion on defining this level for the NBA was had at Tom Tango's blog, and is worth a read. (Tom Tango is a baseball saber-metrics expert,
I needed stats to give a complete representation of a rookie performance. The immediate prospects were the four advanced stats Win Shares. Win Shares Per 48 Minutes, Box Plus Minus, and Value Over Replacement Player. I felt that VORP and BPM were the two best stats to measure rookie performance on a holistic and individual level.
A bit of disclaimer before I continue is that BPM and VORP are pretty much the same stat. VORP is just BPM adjusted to how much that player. If this was a multivariate linear regression, the model could suffer from collinearity. For this specific study we are running separate linear regressions, so collinearity would not be a problem. If that doesn't make sense what I just said, don't worry because that was just a side note.
 |
In this visualization, I am comparing the different market values of all the NBA teams. Teams in larger population cities and with older ages, tend to be more valuable than the opposites.
I think it's interesting to note that the NYK, LAL, and GSW are all around three times more valuable than the five least valuable teams.The next thing I did was create an average BPM and VORP by averaging all 10 years of BPM's and VORP's into one number
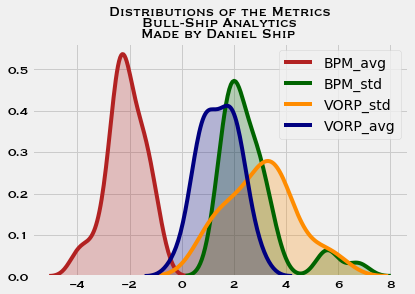
In addition to finding an average, I found the standard deviations of the VORP and BPM over the yearsThe next thing I did was create an average BPM and VORP by averaging all 10 years of BPM's and VORP's into one number. In addition to finding an average, I found the standard deviations of the VORP and BPM over the years.
 |
Here is a visualization showing the BPM average of each team over the 10 year period. The Denver Nuggets and the Miami Heat had the two highest BPM averages. This means, on average their rookies performed the best compared to other NBA averages. Even the teams with the highest average BPM are still in the negatives. On the scale provided by Basketball Reference, this means on average their rookies were closer to a decent "starter/6th man" than to a "Bench Player". The teams with the worst performing rookies using the BPM metric, were on average on a scale of "Bench Players" to "End-Of-Bench Players".
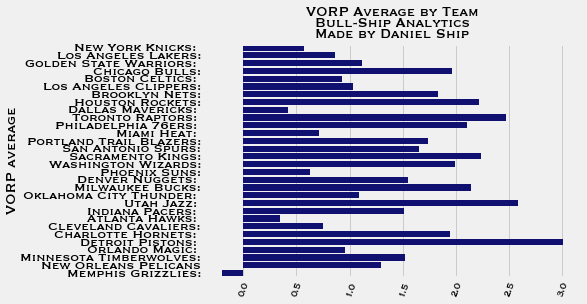
In comparison to the graph depicting the BPM averages by team, the teams with the highest VORP in this picture are not the same as the ones using BPM. I incorrectly had initially thought
VORP and BPM had a high correlation in this analysis. The equation for calculating VORP is [BPM - (-2.0)] (% of possessions played) (team games/82). Since there is such a variance of the playing time rookies play, a rookie who played very little could have an abnormally high BPM. This BPM is not a good valuation of him because of a lack of a sample size aka limited playing time. For this study, I'm going to place a higher consideration for VORP than BPM because of the playing time consideration.
R^2 = 0.027349727255728

R^2 = 0.03622658229996617
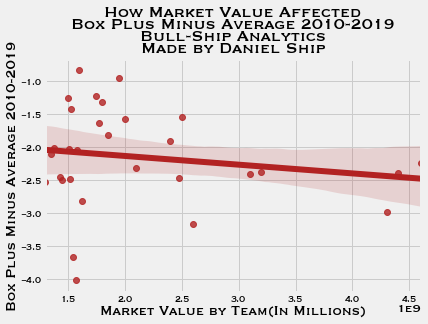
Here is where we actually start to answer the question. What is the correlation between market value and rookie performance? R^2 is the metric we are going to use to find the statistical evidence of the models. R^2 also known as the coefficient of determination is "is a statistical measure that represents the proportion of the variance for a dependent variable that's explained by an independent variable or variables in a regression model"(Investopedia.com). In other words how well the line of best fit fits the data. R^2 is a scale of 0 to 1. 0 being no variance for rookie performance explained by Market Value and 1 being 100% of the rookie performance being explained by the market value.
2.7% of the BPM Averages was explained by the Market Value of the teams
3.6% of the VORP Averages was explained by the Market Value of the teams

R^2 = 0.0630264172349563

R^2 = 0.0798384940036207
6.3% of the BPM Standard Deviation over the years 2010-2019 was explained by the Market Value of the teams
8.0% of the VORP Standard Deviation over the years 2010-2019 was explained by the Market Value of the teams
Final Bull-Ship Analysis: So is there any sort of correlation? The R squared's are very low but not quite zero which means there is a slight correlation between market value and rookie performance.
Although it is interesting to see a slight correlation between market value and rookie performance, there is so many other variables to consider in terms of projecting rookie chances of success? I will just name a few of them off the top of my head, but I will certainly miss some.
The coaching staff: If you are being coached by Greg Popovich of the San Antonio Spurs vs the middle school esque coach Jim Boylen of the Chicago Bulls. You are probably going to be better developed as a rookie under the goat, POP.
The organization's ability to accurately find talent that is transferable to the NBA: Some teams are simply bad at drafting players or develop projects that they do not know how to develop into the NBA. Think Frank Ntilikina of the New York Knicks. The Knicks knew he was a project when they drafted him but have failed to develop him as an average NBA player.
Years in college-Players that stay the complete four years in college are thought to perform better as rookies because they had time to develop more in college.
This was my first dive into answering a NBA question utilizing analysis tools such as Excel and Python. If you have any questions or would like to give me any sort of input for my future endeavors. Feel free to contact me at ship.daniel8100@gmail.com
Stay Classy,
Bull-Ship Analytics
Comments
Post a Comment